This is Part 1 of 4 in the Fitness Series. The full path:
- Part 1 - The Goal (2 sub-articles):
- Part 1.1 (this article): What Actually Matters?
- Part 1.2: Recomp, Cut, or Bulk - How to Actually Decide
- Part 2: Structure of a Day - the daily framework
- Part 3 - The Program (3 sub-articles):
- Part 3.1: Concepts - the conceptual foundation
- Part 3.2: Rules and Building the Program - contexts
- Part 3.3: Example Programs - practicalities
- Part 4: Pharmacology - supplements and beyond
Table of Contents
- Why this Fitness Series exists
- Fit vs. Healthy
- Fitness can be measured and measurable benchmarks matter
- Important: How benchmarking is used
- Aesthetic broken down
- How muscle actually grows
- Strength and size are linked (for naturals especially)
- Part 1.1 Takeaways
- Your Day 1 Task List
- Sources & references
Why this Fitness Series exists
There’s a framework for making decisions, and the decisions look different at different points in the journey. So this is going to be four interconnected articles that lay the whole thing out: how to think about the goal (this article and Part 1.2), how to structure the day around the goal (Part 2), how to program the training (Part 3), and what pharmacology to consider (Part 4).
This first part is the foundation. If the goal-setting is wrong, no protocol downstream will fix it.
Fit vs. Healthy
p.s: They’re not the same thing
Before anything else, separate these two ideas. “Healthy” is measured through biomarkers (blood panels, resting heart rate, HRV, VO2 max, lipid profile, fasting insulin, HbA1c). These are the things a doctor cares about, and they should matter to anyone serious about training. But this article isn’t about those.
This article is about being fit, which is a different goal with different measurements. There are four benchmarks to use:
- Aesthetic — how you look
- Strength — how much force you can produce
- Agility — how fast and reactive you are
- Endurance — how long you can sustain effort
I would argue, however, that Agility and Endurance actually belong to a completely different category: Athleticism. Unless you are training for a specific sport, stepping onto a field, or running a marathon, those aren’t usually the metrics driving your workouts.
For the average gym-goer, the daily grind really boils down to just two things: Aesthetic and Strength. For natural lifters especially, these two are tightly coupled, you can’t really pursue one without understanding the other, which we’ll come back to.
Fitness can be measured and measurable benchmarks (and rate of progress) matter
What makes the “fit benchmarks” useful is that every single one of them can be measured quantitatively. That’s what makes progress predictable. The measurements come in two flavors.
- Relative Measurement
- Range Measurement
Relative measurements: strength standards
Relative measurements scale to bodyweight. A 150 kg bench press is impressive at 80 kg bodyweight (almost a 2× ratio), but at 150 kg bodyweight that same lift is mediocre. Strength benchmarks are almost always relative.
Here’s a practical reference table for the four main barbell lifts. These are the population-level standards for natural male lifters, expressed as a multiple of bodyweight:
| Lift | Beginner | Intermediate | Advanced | Elite |
|---|---|---|---|---|
| Bench Press | 0.5× BW | 1.0× BW | 1.5× BW | 2.0× BW |
| Back Squat | 0.75× BW | 1.25× BW | 1.75× BW | 2.5× BW |
| Deadlift | 1.0× BW | 1.5× BW | 2.0× BW | 2.75× BW |
| Overhead Press | 0.35× BW | 0.65× BW | 1.0× BW | 1.4× BW |
For a concrete example: an 80 kg natural lifter pressing 160 kg on bench (2× BW) is genuinely elite, these are top 1% numbers and typically take 5–10+ years of optimized training to reach. Most consistent lifters land in the intermediate-to-advanced band after 2–4 years.1
For women, the multipliers run roughly 60–70% of male values for upper body and 75–85% for lower body, owing to physiological differences in muscle distribution and hormone levels.2
Range measurements: body composition and cardiovascular
Range measurements are population-level standards that don’t depend on size. These have established healthy and elite ranges that apply to most adults, so they’re easier to use as goalposts.
Useful ranges to know:
- Body fat percentage — ~10–14% is “lean and visible abs” for men, ~15–19% is “athletic without visible abs,” ~20%+ is when muscle definition starts disappearing. For women, add roughly 8–10 percentage points to each band.
- FFMI (Fat-Free Mass Index) — ~25 is the practical natural ceiling for men. Most lifters land between 20 and 23 after several years of consistent training.3
- Resting heart rate (RHR) — 60–80 bpm is normal, 50–60 is well-conditioned, sub-50 is athletic.
- Heart Rate Variability (HRV) — higher is better; tracking your own trend over time matters more than the absolute number.
- Pace per kilometer / VO2 max — standard endurance benchmarks for cardio progression.
Rate of progress as a signal
Once these measurements are being tracked, the second-order benefit is that the rate of progress itself becomes a signal.
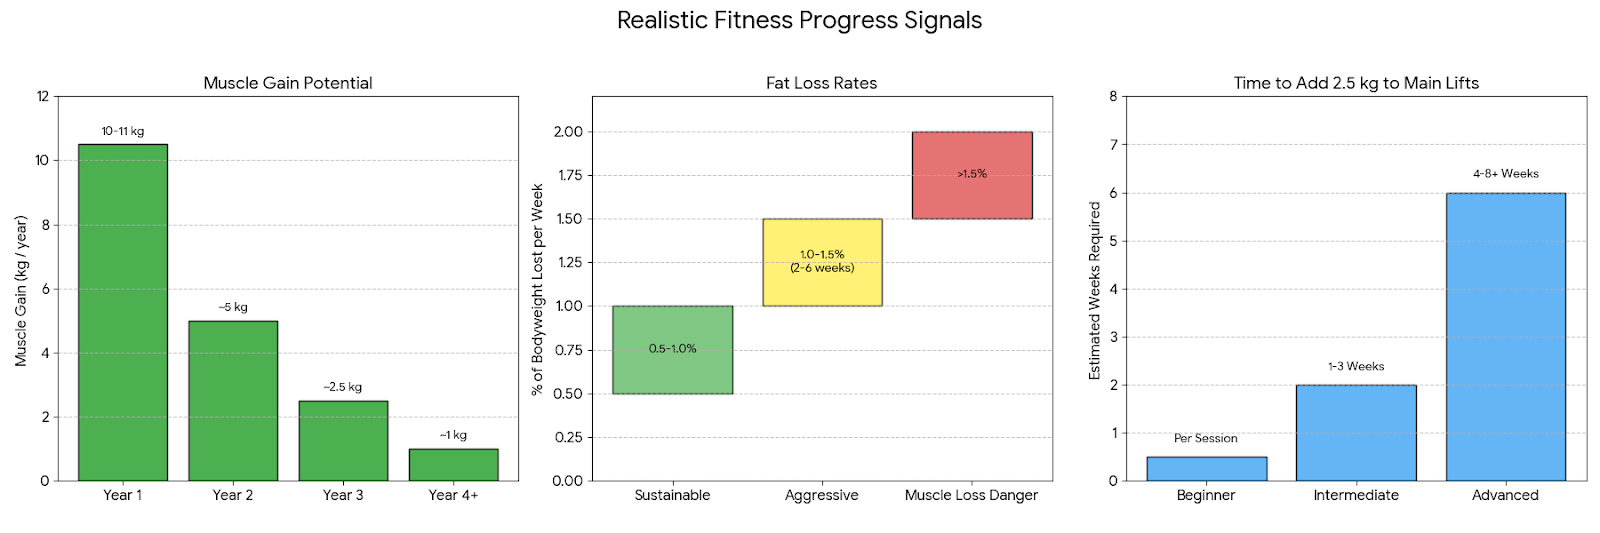
Here’s what realistic progress actually looks like for natural lifters.
Muscle gain (Lyle McDonald’s model):4
- Year 1 — ~10–11 kg of muscle (about 1 kg/month)
- Year 2 — ~5 kg (about 0.5 kg/month)
- Year 3 — ~2.5 kg (about 0.2 kg/month)
- Year 4+ — ~1 kg/year, then tapering further
The gap between “Year 1 of training” and “Year 1 of proper training with compound lifts, progressive overload, and a real program” is enormous. The more advanced you get, the slower the gains, which makes accurate measurement more important, not less.
Fat loss:
- 0.5–1.0% of bodyweight per week: sustainable cutting rate. For an 80 kg person, that’s 0.4–0.8 kg per week.
- 1.0–1.5% per week: aggressive, doable for short mini-cuts (2–6 weeks) but hard to sustain.
- More than 1.5% per week: almost always means meaningful muscle is being lost alongside the fat.
Strength progression (per main lift, double-progression model):
- Beginner: +2.5 kg per session on most lifts
- Intermediate: +2.5 kg every 1–3 weeks
- Advanced: +2.5 kg every 4–8 weeks, sometimes longer
How Benchmarking is Used (The Diagnostic Decision Tree)
Super Important
When the data is being tracked, deviations from these ranges become diagnostic. Instead of guessing why a phase isn’t working, you can use the combination of your bodyweight trend, strength markers, and visual/composition changes to pinpoint the exact problem.
Branch 1: The Cut (Fat Loss Phase)
GOAL
Losing 0.5–1.0% body fat (not bodyweight) per week while maintaining strength.
- Symptom: Weight is dropping at the target rate (e.g., 0.5 kg/week), but strength across all lifts is plummeting fast.
- Diagnosis: The deficit is correct, but muscle is being cannibalized.****
- Action: Protein intake is likely too low, or training volume is too high (causing recovery debt). Increase daily protein and reduce the number of working sets by 20% to allow for recovery while in a deficit.****
- Symptom: Weight is completely stagnant for 2+ weeks, but strength (especially on compound lifts like Squats or RDLs) is steadily increasing.
- Diagnosis: Body recomposition. You are simultaneously losing fat and gaining muscle, meaning you are actually eating at maintenance calories, not a deficit.
- Action: If the primary goal is strict fat loss, drop calories by another 200-300/day. If you are happy getting stronger and leaner at the same weight, change nothing.
- Symptom: Weight isn’t dropping, strength is stagnant, sleep is poor, and you feel constantly flattened.
- Diagnosis: Diet fatigue or high systemic cortisol masking weight loss (water retention).
- Action: Do not drop calories further. Implement a 1-to-2 week diet break at maintenance calories to normalize hormones and shed fatigue before resuming the cut.
Branch 2: The Bulk (Muscle Gain Phase)
Goal
Gaining 1–2 kg lean mass per month with steady strength progression.
- Symptom: Weight is climbing rapidly (>1 kg per week), but strength on main lifts is barely moving.
- Diagnosis: Pure fat gain. The caloric surplus is far too high, and the muscle isn’t being stimulated enough to use the extra energy for growth.
- Action: Cut the caloric surplus in half. Audit your training intensity—ensure working sets are actually taken close to failure (1-2 RIR).
- Symptom: Weight is stable (not gaining), but strength is progressing perfectly on schedule.
- Diagnosis: “Maingaining.” The training stimulus is excellent, but there isn’t enough energy to build meaningful new tissue mass.
- Action: This is a great spot to be in, but if maximum hypertrophy is the goal, you need to force the scale up. Add 200-300 clean calories (e.g., an extra serving of carbohydrates pre-workout) to your daily intake.
Branch 3: The Performance Phase (Strength Stalls)
GOAL
The goal is predictable, measurable increases in force production over time.
- Symptom: Hitting a wall on every main lift simultaneously (Bench, Squat, RDL, Overhead Press all stall in the same week).
- Diagnosis: Systemic fatigue. This is a recovery problem, not a programming problem.
- Action: Take a mandatory deload week. Cut volume (sets/reps) in half and keep intensity moderate to let the central nervous system recover.
- Symptom: Stalling on one specific lift (e.g., Bench Press is stuck for a month), while lower body lifts continue to progress normally.
- Diagnosis: Localized fatigue or a mechanical bottleneck specific to that movement pattern.
- Action: Swap the primary accessory movements for that lift (e.g., switch from dumbbell bench to weighted dips) to target the weak point, or adjust your grip/stance to change the leverage.
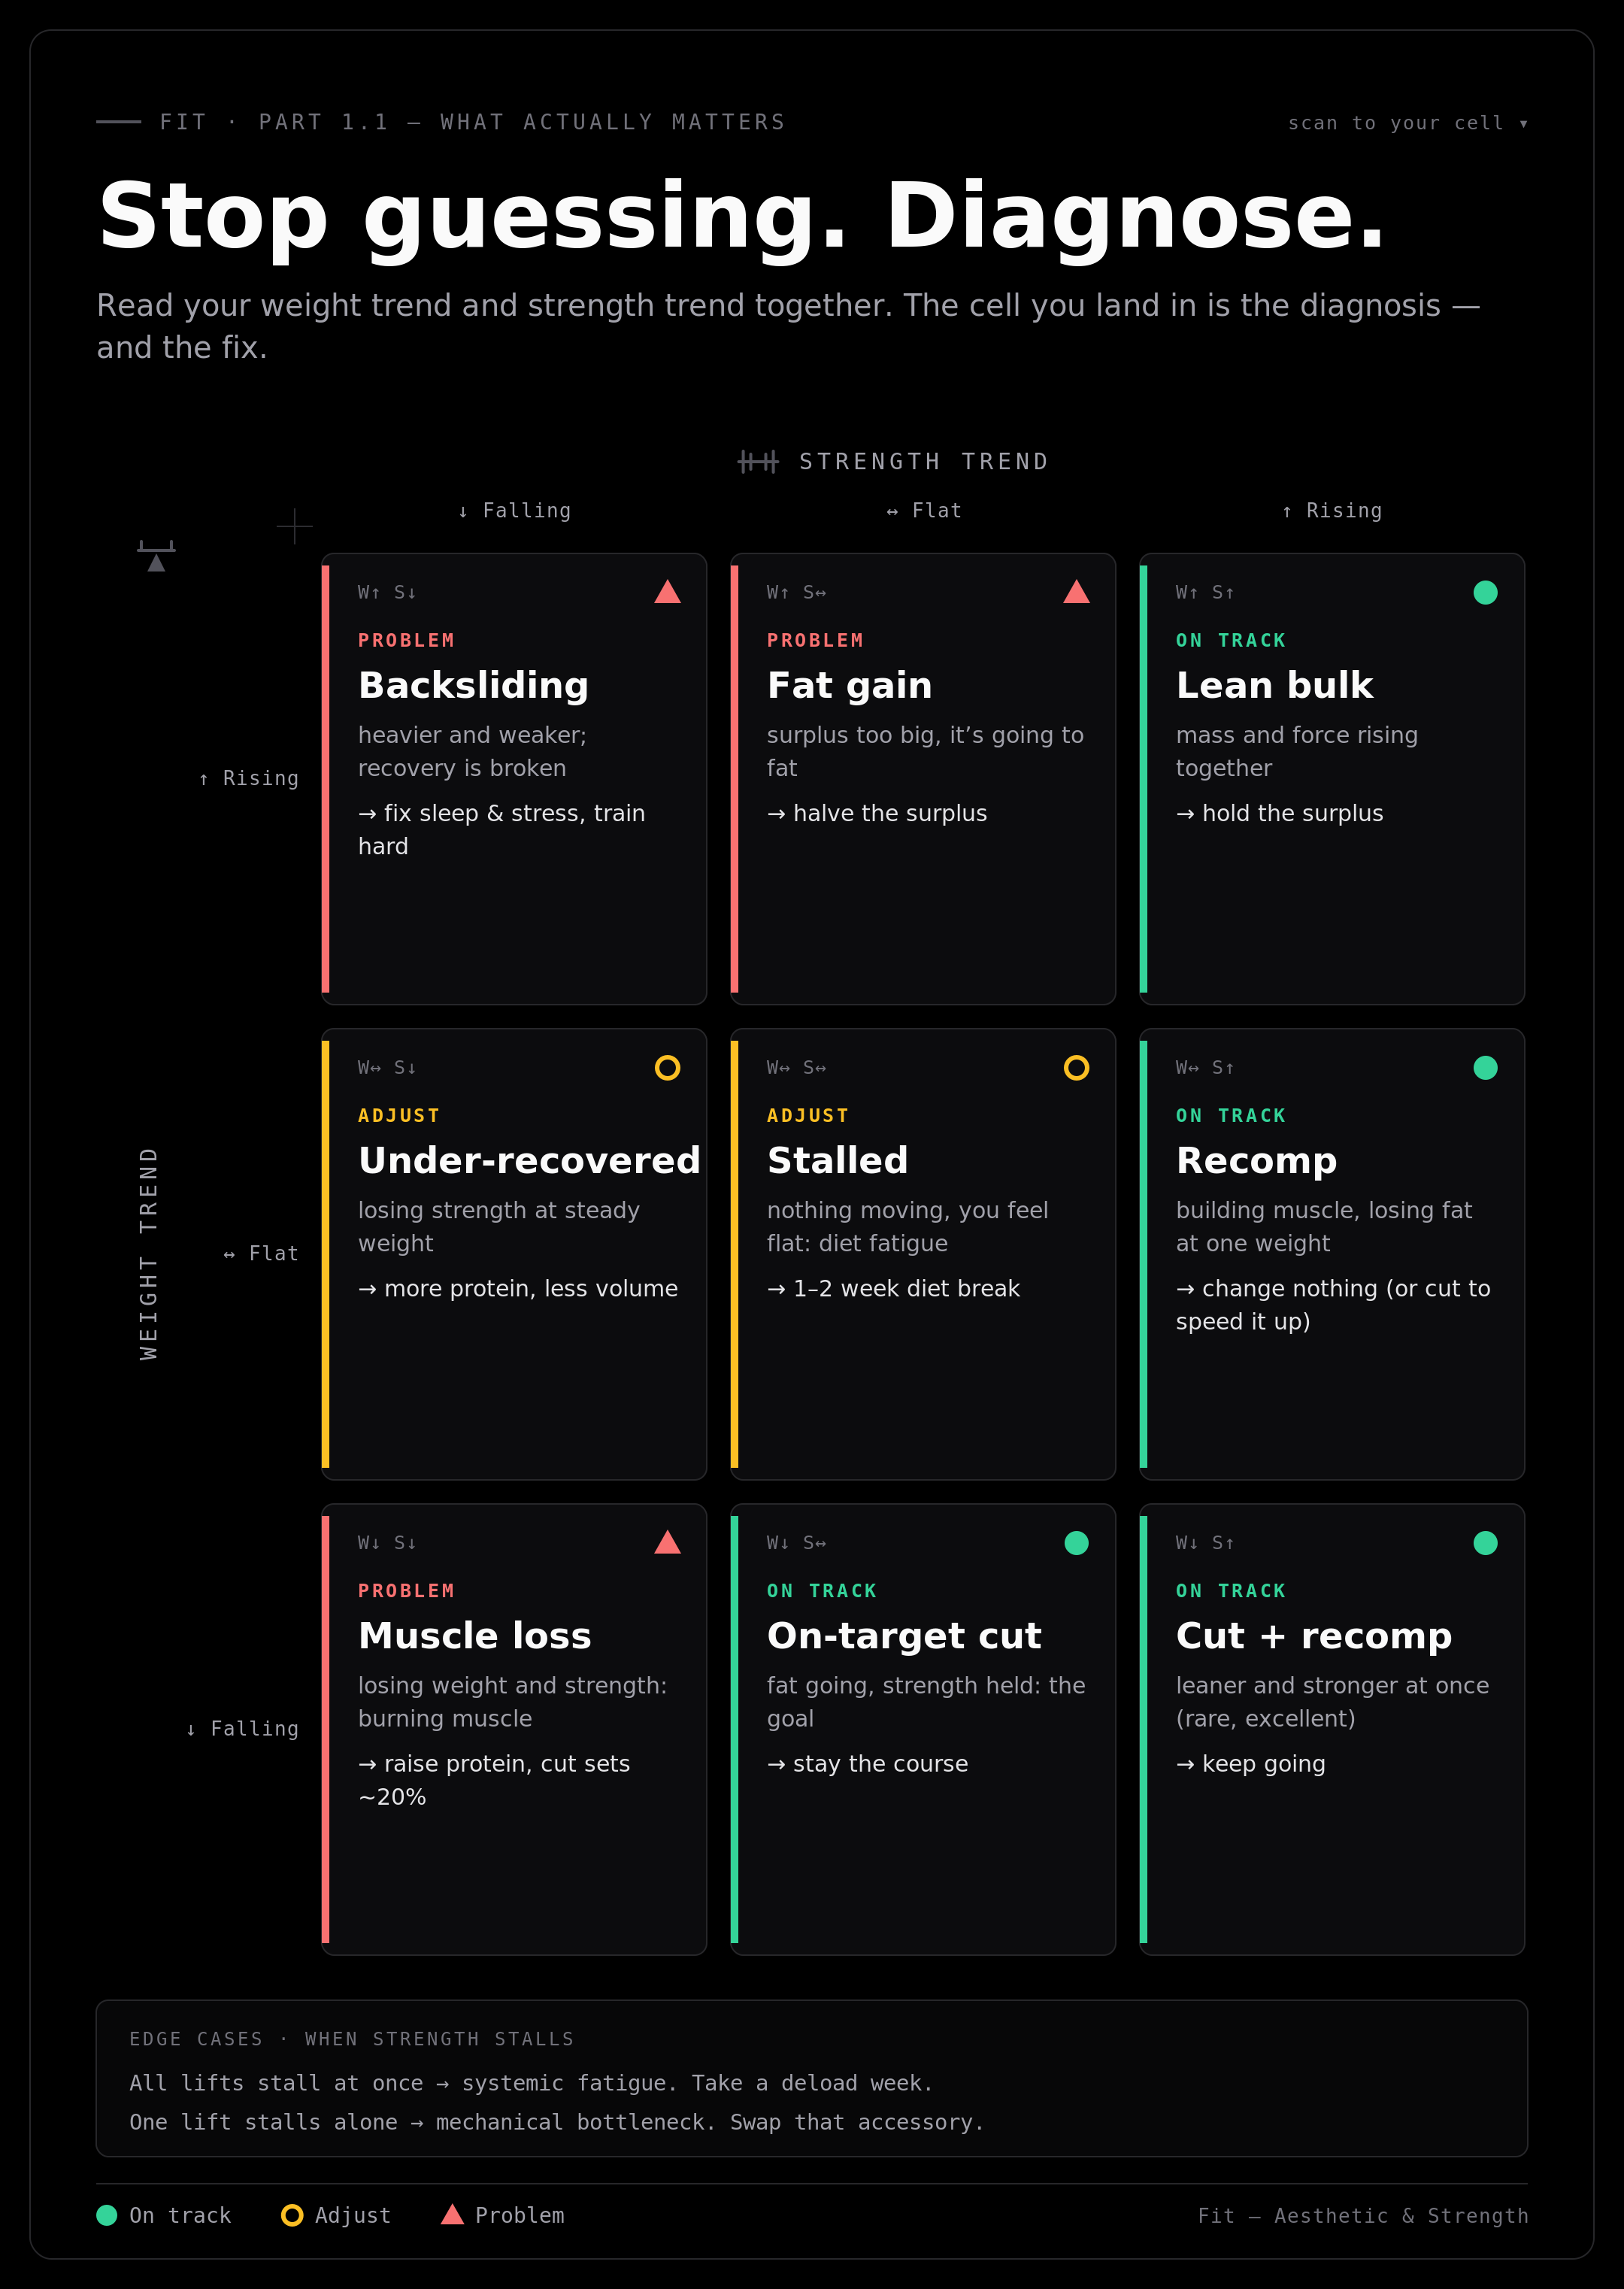
Ultimately, this is how benchmarking and the rate of progress transform training from guesswork into a predictable system. We aren’t just logging numbers to see how far we’ve come or how far we have left to go. We are establishing concrete goals (which most gym-goers lack) and building a diagnostic system to troubleshoot our own bodies when things stall. When you use data to dictate your decisions, it actually becomes difficult not to make progress.
Here’s that whole diagnostic system as one card you can actually read. Everything in the three branches above reduces to a single move — read your weight trend and strength trend together — so below, find the cell where your two trends meet and it names what’s happening and the one fix. Watch how the strength-rising column reads fine all the way down: that’s the “chase strength” lesson made visible. Pin it up and re-check it every week.
The only variable left is execution: you have to actually track the numbers consistently. To keep the friction low, split the data collection across a dedicated tool stack:
- Hevy: For tracking the workout data—logging strength metrics, set-by-set volume, and progressive overload on your main lifts.
- MacroFactor: For tracking the nutrition and scale data—logging daily weight trends, caloric intake, and monitoring your exact rate of gain or loss.
- InBody: For tracking body composition—measuring the “under the hood” metrics like body fat percentage, skeletal muscle mass, and fat-free mass to ensure the weight you are gaining or losing is the right kind.
So what actually matters for Aesthetic and Strength?
Two goals, two dashboards. Everything else (agility, endurance, RHR, HRV) can be tracked and is worth knowing, but for someone focused purely on Aesthetic and Strength, there are four numbers that do the real work.
Strength KPIs:
| Lift | Target |
|---|---|
| Bench Press | Work toward 1.0× BW (intermediate) → 1.5× BW (advanced) |
| Lat Pulldown / Pull-ups | 10 strict bodyweight pull-ups as a baseline; weighted pull-ups for progression |
| Overhead Press (OHP) | 0.75× BW (intermediate) → 1.0× BW (advanced) |
| Squat Pattern | 1.5× BW (intermediate) → 2.0× BW (advanced) for Barbell Squats. |
| Deadlift | 1.5× BW (Intermediate) → 2.0× to 2.5× BW (advanced) |
| Romanian Deadlift (RDL) | 1.25× BW (Intermediate) → 1.75× BW (advanced) for 8–10 reps. |
| Barbell Row / Chest-Supported Row: | 0.75× BW (Intermediate) → 1.25× BW (advanced) |
| Leg Extension / Leg Curl | 0.5× BW → 0.8× BW for strict reps (Machine-dependent). |
| Weighted Tricep Dip | Bodyweight + 0.25× BW (intermediate) → Bodyweight + 0.6× BW (advanced) |
| Preacher Curl | 0.3× BW → 0.5× BW for strict, controlled reps (e.g., curling 60–85 lbs strictly). |
Aesthetic KPIs:
| Metric | Target |
|---|---|
| Body Fat % | Men: 10–14% (lean, visible abs) → sub-10% (stage lean, not sustainable). Women: add ~8–10 pp to each band. |
| FFMI | 20–23 is realistic after years of consistent training. ~25 is the practical natural ceiling. |
FFMI (Fat-Free Mass Index) is calculated as:
Or equivalently: take your total weight, subtract the fat mass, divide by height in meters squared. An 80 kg man at 15% body fat has 68 kg of lean mass — at 1.78 m, that’s an FFMI of 21.5. Solidly intermediate.
Why FFMI matters more than scale weight Scale weight is nearly useless on its own. Someone at 80 kg can look completely different depending on body composition. FFMI normalizes for height and strips out fat, so it actually measures what was built. Two people at the same FFMI and the same body fat will look roughly similar, regardless of height.
Now, notice something: bench press, pull-ups, and FFMI are all relatively straightforward to track. Bench goes up or down. Pull-ups are countable. FFMI just needs lean mass and height. The one metric that causes consistent trouble is body fat percentage. It’s also the one that feeds directly into FFMI (because lean mass = total weight × (1 − body fat fraction)), which means getting it wrong cascades into getting FFMI wrong too.
That’s why it’s worth spending a moment understanding how body fat is actually measured and how much to trust different methods.
Understanding body fat measurement: the three scanner tiers
Body fat percentage is the most commonly tracked range measurement, and it’s worth understanding that not all measurements are equal. There are three tiers of accuracy.
-
Tier 1 — Consumer bioimpedance scales The body-fat scales sold for home use, typically RM200-RM300. Run a small electrical current through the body and estimate fat mass based on resistance.
- Margin of error: ±3–5% under ideal conditions, ±5–8% in practice.5 A single glass of water can change the reading. Useful for trends if everything else is controlled (same time of day, same hydration), useless for absolute numbers.
-
Tier 2 — Commercial-grade BIA (InBody and similar) Gym-grade machines that scan segment by segment with hand and foot electrodes. More accurate than consumer scales and they break out segmental data (arms, legs, trunk). RM20-RM50/per scan.
- Margin of error: ±3–5%, with hydration sensitivity. A 2025 study comparing InBody to DEXA found the InBody underestimated fat mass by an average of 3.7 kg in men.6 Worth using for tracking trends when DEXA isn’t accessible. Don’t trust the absolute number to within less than 3 percentage points.
-
Tier 3 — DEXA (Dual-Energy X-ray Absorptiometry) The clinical gold standard. Uses two low-dose X-ray beams to directly measure bone density, fat mass, and lean mass with regional breakdown.
- Margin of error: ±1–2%, with calibration repeatability under 0.5%.7 Distinguishes visceral fat (the dangerous fat around organs) from subcutaneous fat. Downsides are cost (RM200 - RM400 per scan) and access (specialty clinics, not gyms, specifically Sunway Medical facilities).
The practical play Use a daily home scale for trend tracking, and get a DEXA scan every 3–6 months for an honest reset. That's the cheapest way to combine continuous data with anchored accuracy.
NOTE
- So we’re able to track what matters (by understanding health vs. fit, measurement examples),
- We’re also have establish what tracking that matters (KPI for strength, and aesthetic, what the goal are)
- We’re also understand signals from our tracking (diagnose expected signal, tweak what doesn’t work),
The next question would be, why do we track these metrics specifically?
Let’s understand Aesthetic, and then it’s relationship with Strength.
Aesthetic broken down
When people say “I want to look good,” they usually mean three different things at once. It’s worth separating them:
- Muscularity
- Size and Density.
- How big the muscle is, and how packed-tight it looks at rest.
- Size and Density.
- Conditioning
- Granularity and Vascularity.
- Whether you can see the separations between muscles, and whether veins are visible. This is essentially a body fat conversation.
- Granularity and Vascularity.
- Symmetry
- Proportion and Balance.
- The ratios between body parts (shoulders to waist, arms to legs) and left-to-right balance. This is mostly genetic frame plus targeted training to fix lagging areas.
- Proportion and Balance.
Muscularity is built through training and a calorie surplus or maintenance. Conditioning is unlocked by losing fat. Symmetry is fixed by being intelligent about exercise selection over years. Different problems, different solutions.
So to understand and achieve muscularity, we have to understand how muscle actually grows.
How muscle actually grows
There are several mechanisms by which a muscle can get bigger. Three matter most:
- Myofibrillar hypertrophy — adding more contractile proteins (actin and myosin) inside the fiber. The fiber itself gets thicker. This is permanent, strength-relevant growth.
- Sarcoplasmic hypertrophy — expansion of the non-contractile fluid in the cell (glycogen, water, enzymes). Produces the “pump” and visible fullness, but it’s transient, when training stops or glycogen drops, this fades.8
- Satellite cell-mediated growth — satellite cells donate nuclei to existing fibers, raising the ceiling on how much protein the fiber can synthesize long-term. This is what compounds over years.9
For an enhanced lifter, the picture is more complex, exogenous androgens directly upregulate androgen receptor density, nutrient partitioning gets pharmacologically rigged, and water/glycogen retention is amplified. For a natural lifter, the only growth that really matters is myofibrillar hypertrophy backed by satellite cell activity. That’s the kind that doesn’t disappear when you take a deload week or cut.
So to gain in size, it's inevitable to gain in strength.
Strength and size are linked (for naturals especially)
The chain looks like this:
more strength → more force production → more motor units recruited per set → more fibers stimulated → more growth signal → more fiber → more strength next time
Strength and hypertrophy aren’t identical, a powerlifter and a bodybuilder of the same muscle mass will have different strength numbers because of neural and skill specificity. But they are correlated, and for natural lifters they’re correlated tightly enough that chasing strength on the right exercises is a reliable proxy for chasing size.
This is why Part 3.1 will spend so much time on the strength-stimulus relationship, it’s the lever that drives everything in the program layer.
Now that we’ve covered how to build muscularity, in Part 1.2, we’ll dive into the science of fat loss, specifically lipolysis because stripping away body fat is the ultimate key to achieving conditioning.
Part 1.1 Takeaways
Key concepts to internalize
- Fit vs. Healthy: Biomarkers tell you if you’re living; KPIs tell you if you’re performing.
- The Natural Link: For us, strength is the most honest proxy for size.
- Data Integrity: Your scale lies, but a DEXA or a 7-day average does not.
- The Metric that Matters: FFMI is your “true” progress bar; it ignores the fluff and measures the meat.
- Three aesthetic dimensions: Muscularity (training + calories), Conditioning (fat loss), Symmetry (years of intelligent selection). Different problems, different solutions.
- Diminishing returns are real: Year 1 = ~10 kg muscle. Year 4+ = ~1 kg/year. The more advanced you get, the more accurate measurement matters.
Your Day 1 Task List
Before moving to the next article, you need to anchor your current reality. Do not guess these numbers.
- Get Scanned: Get a professional body composition scan. In Malaysia, head to Columbia Asia Hospital for a DEXA (the gold standard) or visit a Pump Fitness Branch or any gym with a commercial InBody machine.
- The Visual Record: Take current photos. Front, side, and back. No “Instagram angles”—just honest, flat-lit baseline photos.
- Calculate your FFMI
- Log starting strength benchmarks: For each of the lifts in the Strength KPI table, record your current honest 8-rep working weight. This is your Day 1 anchor.
- Prep the Data Layer: Download HEVY. We will go into the “how-to” in Part 3.2, but you need it now to begin logging.
Up next would be Part 1.2 - How to Actually Decide whether to bulk, cut or recompose, and what those means (super important).
For how to structure the day around all this — when to eat, when to train, when to walk, how to track — go to Part 2 — Structure of a Day.
To skip ahead to programming, go to Part 3.1 — The Program: Concepts.
For the pharmacology side, go to Part 4 — Pharmacology.
Disclaimer Not medical advice. Everything here reflects personal experience and reading of the research. Consult a medical professional before making significant changes to diet, training, or supplement protocol — especially with underlying health conditions.
Sources & references
Footnotes
-
Strength standards based on bodyweight ratios across millions of logged lifts. See Strength Level’s database (153M+ lifts) and the practical bands at calcffmi.com/strength-standards and arvo.guru/resources/strength-standards. Reaching elite (top 1%) typically requires 5–10+ years of optimized natural training. ↩
-
Female strength multipliers documented at arvo.guru/resources/strength-standards and Legion Athletics’ standards review. Lower-body gap is smaller than upper-body gap. ↩
-
Casey Butt’s research on the relationship between bone structure (wrist/ankle circumference) and natural muscle ceiling, plus Kouri et al. (1995) on the FFMI distinction between drug-tested and steroid-using lifters. Discussion at rippedbody.com/maximum-muscular-potential and mennohenselmans.com/ffmi-calculator. ↩
-
Lyle McDonald’s natural muscle gain model, widely cited. Original at bodyrecomposition.com — genetic muscular potential, summary tables at legionathletics.com — how to build muscle naturally. ↩
-
Bioimpedance scale margin of error: ±3–5% under controlled conditions, often worse in practice. See wearebod.com — DEXA scan vs bioimpedance accuracy. ↩
-
Looney et al. (2025), comparison of InBody to DEXA finding ~3.7 kg fat mass underestimation in men and ~1.9 kg in women. Summary at bodyspec.com — InBody vs DEXA. ↩
-
DEXA accuracy ±1–2%, calibration repeatability under 0.5%. Shepherd et al. (2017). See ospreypolyclinic.com — InBody vs DEXA and bodyfatusa.com — DEXA vs other methods. ↩
-
Sarcoplasmic vs. myofibrillar hypertrophy: review at Wikipedia — Muscle hypertrophy and the more detailed scientific treatment at ScienceDirect — Load-induced human skeletal muscle hypertrophy. ↩
-
Satellite cell mechanism: Bazgir et al., “Satellite Cells Contribution to Exercise Mediated Muscle Hypertrophy and Repair.” PubMed Central — PMC5086326. ↩